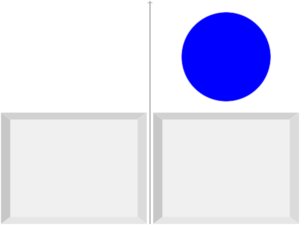
Experience the effects in ms of the Simon Task
“C2 Simon Task” is an iOS app to experience the effects of the Simon Task.
It can be used on iPhone and iPad with iOS 14 or above.
About “C2 Simon Task”
The iOS app “C2 Simon Task” records the response time of a Simon Task (task conflict) in milliseconds.
Response time is the time from when an task is displayed to when you touchdown the answer button.
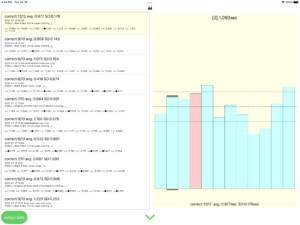
The data can be output as a CSV file (encoding=UTF-8) and read by a spreadsheet application such as Excel.
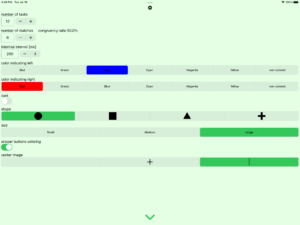
You can check the effect by changing the trial interval, left and right colors, shape of the shape, size of the shape, brightness of the background, and so on.
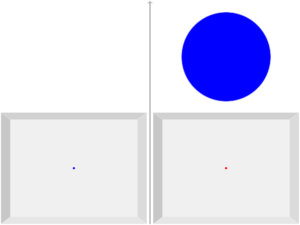
※ The effect of the Simon task appears, for example, in the following two cases as the difference in time for recognizing the left and right positions indicated by the color.
・ When a figure with a color indicating the left is displayed on the left side (compatible)
・ When a figure with a color indicating the right is displayed on the left side (incompatible)
How to use “C2 Simon Task”
The “C2 Simon Task” supports portrait mode as well as landscape mode, but here we will use only landscape mode images.
Start
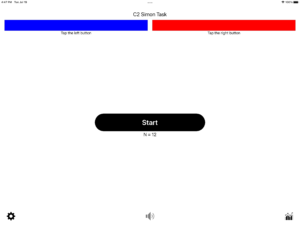
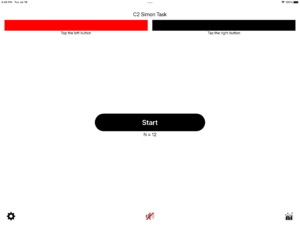
If you tap the “Start” button on the startup screen, the Simon Task will be displayed after the 3-2-1 countdown.
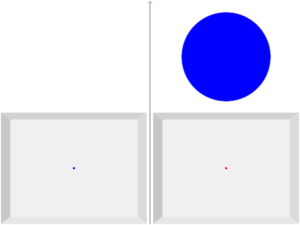
If you answer the left or right position indicated by the color in the figure, the next task will be displayed after the trial interval. The left or right position indicated by the color in the figure may or may not match the actual left or right position.
When you answer the number of tasks, the number of correct answers and the average response time are displayed, and the process ends. (At this time, you can leave a note if necessary.)

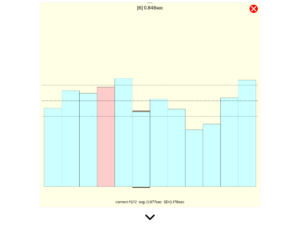
You can graph detailed information about response time by tapping the i button at the top right of the end view. Tap (or pan on) the graph to see the corresponding nth response time at the top.
Settings

Tap the settings button at the bottom left of the startup screen to display the settings screen.

Settings:number of tasks
number of tasks (N) is the number of simon tasks that are given consecutively. It can be set in the range of 5 to 30.
The initial value is 10.
Settings:number of matches
The number of matches is the number of tasks whose left or right position indicated by the color of the figure matches the actual left or right position.
The number of unmatches is [number of tasks – number of matches], and the congruency ratio is [(number of matches / number of tasks) x 100%].
Settings:intertrial interval [ms]
The intertrial interval is the time between when the answer button was pressed in the previous task and when the next task is displayed. (Actually, there is an error of about 10ms.)
The intertrial interval can be set in 100ms increments.
Settings:color indicating left, color indicating right
You can select the color indicating left and the color indicating right from seven colors.
If you select non-colored, white or black is selected depending on the dark setting.
dark ON white
dark OFF black
Settings:dark
When dark ON, the background of the task display is black, and when OFF, it is white.

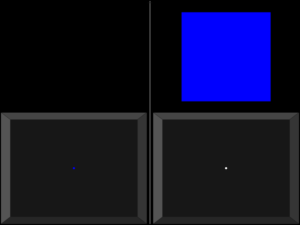
Settings : shape
The shape of the figure can be selected from circle, square, triangle, and cross.
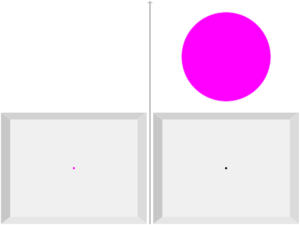
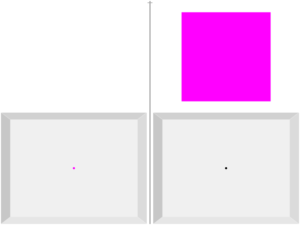
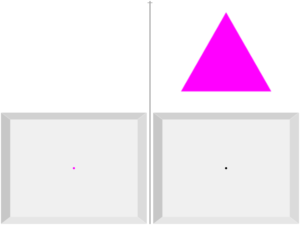
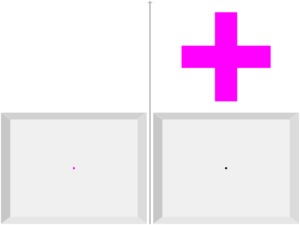
Settings : size
You can select the size of the figure from large, medium, and small.
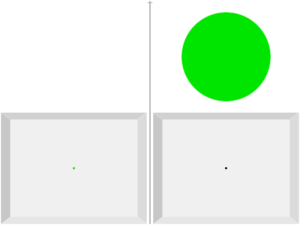
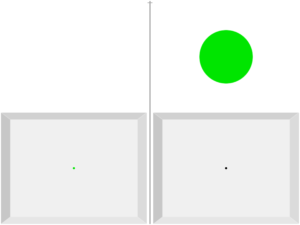
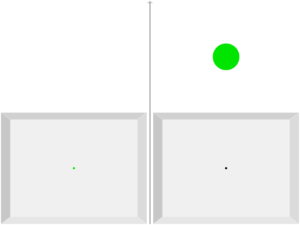
Small
If you turn on “answer buttons coloring”, the color will be displayed in the center of the answer button.
Settings : center image
The center image can be selected from none, +, and vertical line.
Sound on / off
When answering, you will hear a sound indicating a correct or incorrect answer. To mute sounds, put your iPad or iPhone in mute mode. You can also mute by tapping the speaker button at the bottom of the startup screen.
Data

To check the response time data, tap the graph button at the bottom right of the startup screen.
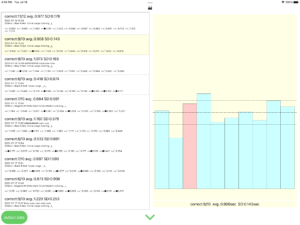
Tap (or pan on) the graph to see the corresponding nth response time at the top.
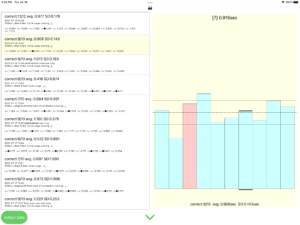
【Contents】
1st line: number of correct answers / number of tasks (N), average and standard deviation of response time [sec]
e.g.:correct:9/10 avg.:0.554 SD:0.107
2nd line: start time, note
e.g.:2022-07-19 14:35 note note note note
3rd line: intertrial interval, color indicating left, color indicating right, options
e.g.:200ms L:Blue R:Red Dark Circle Large coloring _|_
* color indicating left is displayed after L :, and color indicating right is displayed after R :.
* The optional “Dark” indicates that the background of the task is displayed in black.
* For the shape of the figure, one of Circle, Square, Triangle, and Cross is displayed.
* For the size of the figure, one of Large, Medium, and Small is displayed.
* “coloring” indicates that the “answer buttons coloring” setting was ON. If it is OFF, it will not be displayed.
* For the center image, “+” is displayed for + and “|” is displayed for vertical line. Not displayed if the center image is none.
From the 4th line: For each task display, the direction indicated by the color of the figure (<: left >: right), the display position of the figure (<: left >: right), the result (◯: correct answer ●: incorrect answer), response time [sec]
e.g.:>>◯0.520 <<◯0.545 <>◯0.566 ><◯0.472 ><◯0.391 <<◯0.548 <>●0.455 >>◯0.787 <<◯0.679 >>◯0.574
Output Data
To output the data as a CSV file, tap the “output data” button at the bottom left of the data screen.
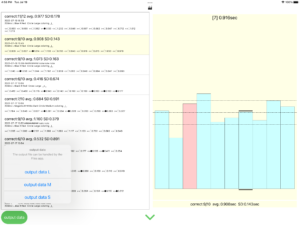
There are three types of data output: L, M, and S. Select L, M, or S from the action sheet to output a CSV file.
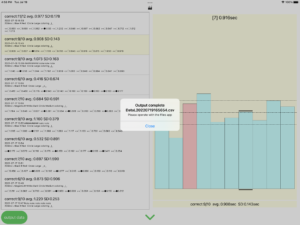
The output CSV file can be operated from the “Files” app.
The following table shows the CSV file opened in Excel on a Mac. The CSV file was sent to the Mac with the “Files” app.
output data L
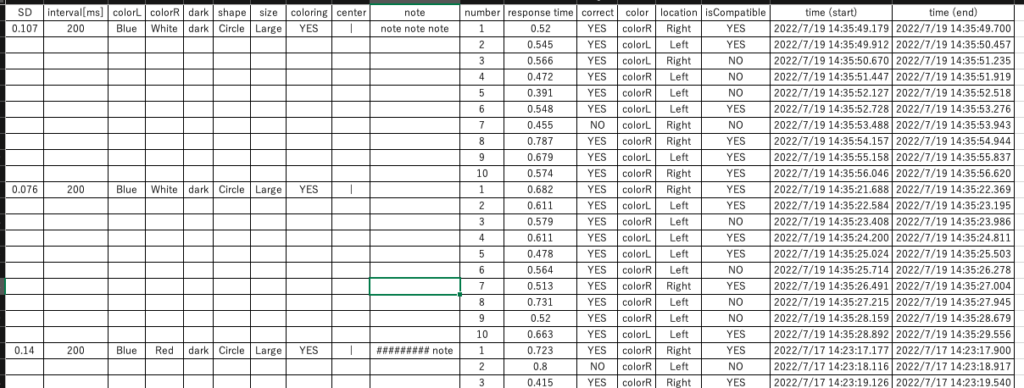
id : ID given to a group of consecutive tasks
N(correct) : number of correct answers
N : number of tasks
Avg. : Average response time
SD : Standard deviation of response time
interval[ms] : intertrial interval [ms]
colorL : color indicating left
colorR : color indicating right
dark : dark=background black light=background white
shape : shape(Circle, Square, Triangle, Cross)
size : size(Large, Medium, Small)
coloring : YES=answer buttons coloring ON NO=answer buttons coloring OFF
center : center image(+, |)
note : notes entered at the end (UTF-8 encoding)
number : task number
response time : response time[sec]
correct : YES=correct NO=incorrect
color : color of the figure (colorL=color indicating left, colorR=color indicating right)
location : location of the figure (Left=displayed on the left, Right=displayed on the right)
isCompatible : compatible/incompatible (YES = The left or right position indicated by the color of the figure matches the actual position, NO = The left or right position indicated by the color of the figure does not match the actual position)
time (start) : the time when the task was displayed
time (end) : the time when the answer button was touched down
output data M
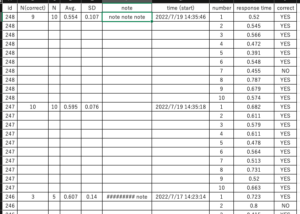
id : ID given to a group of consecutive tasks
N(correct) : number of correct answers
N : number of tasks
Avg. : Average response time
SD : Standard deviation of response time
note : notes entered at the end (UTF-8 encoding)
time (start) : start time
number : task number
response time : response time[sec]
correct : YES=correct NO=incorrect
output data S
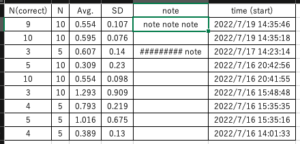
N(correct) : number of correct answers
N : number of tasks
Avg. : Average response time
SD : Standard deviation of response time
note : notes entered at the end (UTF-8 encoding)
time (start) : start time
“C2 Simon Task” Download

Other apps
C2 Stroop Task
Experience the Stroop Effect in ms of the Stroop Task
C2 Flanker Task
Experience the effects in ms of the Eriksen Flanker Task
N’Back 10
N-back task app up to 10’back
An app that makes “N’Back 10” available to multiple users
N’Back 10 Dual
Dual-task version of “N’Back 10”
GP Counter
General-purpose counter that records count time stamps
